Select image to enlarge
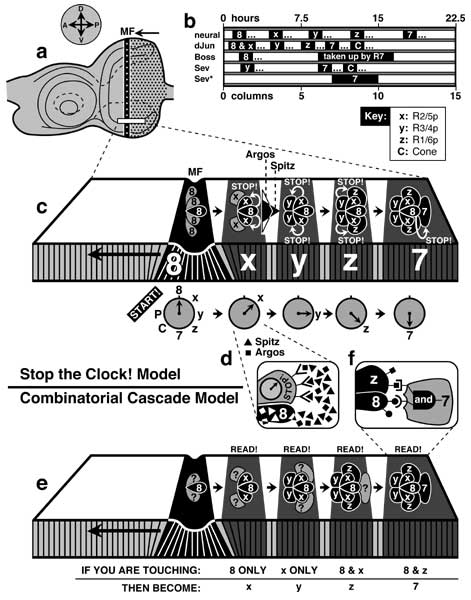
Figure 7.6
Models for recruitment of photoreceptor cells into nascent ommatidia.
a. Mature left eye disc. Vertical stripe is the morphogenetic furrow (MF), which moves from P to A. Compass gives axes in the fate map (cf. Fig. 7.1). In c and e an imaginary slice of the columnar epithelium (boxed in a) is magnified to show how each ommatidium acquires cells after arising as an arc in the MF. Stages are accentuated by stripes (black = MF; gray ≈ later columns) that correspond roughly to columns 0-4 in terms of cluster morphology, though the patterning cues (Stop! or Read!) may occur later. Cells are drawn as ovals (top view; black = determined; gray = uncommitted) or as narrow rectangles (side view).
b. Temporal aspects of photoreceptor development. Abscissa is calibrated in hours (25°C) and in columns of ommatidial clusters relative to the MF (origin). Bars followed by '...' signify onset (bar) and persistence (...), while bars alone indicate total duration. 'Neural' means neuron-specific epitopes recognized by 22C10 and anti-HRP antibodies [1948] (but see [228] for a different pacing and [2322, 4712] for a different order); 'dJun' is expression of dJun (duration ≈ 4 h except cone 'C' cells where it lasts longer); 'Boss' and 'Sev' are expression of these proteins; and 'Sev*' is the period when Sev must be continuously activated for a prospective R7 cell to adopt the R7 fate [2991]. This period (columns 7-10) coincides roughly with the time when Boss is internalized ('taken up') by R7 [2319]. The mitotic band (not shown; cf. Fig. 7.9) roughly spans columns 3-5 [185, 228, 4712]. Omitted: Delta (timecourse ≈ neural) [184, 3273] (cf. Notch [603]). The R8p cell first becomes identifiable in column 0 when it expresses Scabrous and Atonal (not shown) [184, 2042]. Atonal is required for R8 differentiation [4621]. The 'Irregular chiasmC-roughest' protein (not shown) is expressed by cells in the same order as they are thought to be induced (c) [3570].
c, d. The Stop the Clock! Model [1290, 3557] uses two variables: (1) the 'state' of a cell and (2) a 'Stop!' signal. Cells are supposed to automatically progress through a series of transcription factors (states), represented here as a clockface whose numbers and letters reflect cell fate: 7 and 8 refer to R7 and R8; x, y, and z to outer R cells (cf. key for b), and C and P to cone or pigment cells (c). All cells in each column change state synchronously at ~1.5 h intervals (gray bands) -- starting in the MF (Start!) with the R8 state, then x, y, z, R7, and finally (not shown) C and P. The 'Stop!' signal forces cells to keep their current state. It is conveyed by Spitz (white arrows) -- a ligand for Egfr. Each cell emits Spitz within ~1.5 h of receiving a Spitz signal, thus propagating the signal by 'sequential induction' (though the exact 'talking' order is unknown). R7p breaks the chain since (1) it is told to stop by the earliest cell in the series (R8p) and (2) it also requires a Boss signal (transduced by Sev). Since Spitz is diffusible, its concentration should dwindle at increasing distance from its source. This inferred gradient is depicted to the right of the 'x' column (filled triangle), along with a gradient of the ligand Argos (unfilled triangle) -- a competitive inhibitor. Spitz and Argos are both produced by whichever cell is signaling at any time (e.g., R8p in d), but the Argos gradient is shallower because Argos diffuses faster [1288, 1290, 1294, 2331]. Thus, Spitz will be louder than Argos for cells next to the vocal cell (hence stopping their clock) but softer than Argos for cells farther away (hence letting them tick). See [2762, 2811, 3644-3646] for older models in this genre.
e, f. The Combinatorial Cascade Model [602, 3540, 4364] uses Boolean combinations of cell-surface ligands to elicit certain states in adjacent cells. The rules are given below. For example, the rule depicted in f is: 'If you are touching an 8 cell AND a z cell, then become a 7 cell.' Each signaling cell was thought to exhibit a unique ligand (round vs. square lollipops on 8 vs. z), and each receiving cell was thought to have various receptors. This model lost credibility when the Boss-Sev signaling pathway was shown to operate directly (without being combined with other signals) [225], and when the Egfr receptor was found to used repeatedly throughout the sequential induction chain [1289]. In both models, previously determined cells (black) talk to uncommitted cells (gray and '?'). Both models use 'inductive signals', but the former uses them permissively while the latter uses them instructively [196].
Data in b are from [383, 2991, 4360, 4364, 4715]. Cross-sections in c and e are schematics simplified from [3540]. See [605, 4890] for a 3-dimensional perspective. The cartoon in f is adapted from [1290, 2351, 3538]. See also App. 7.
|
|