

Deep Homology?
| |
Deep Homology? |
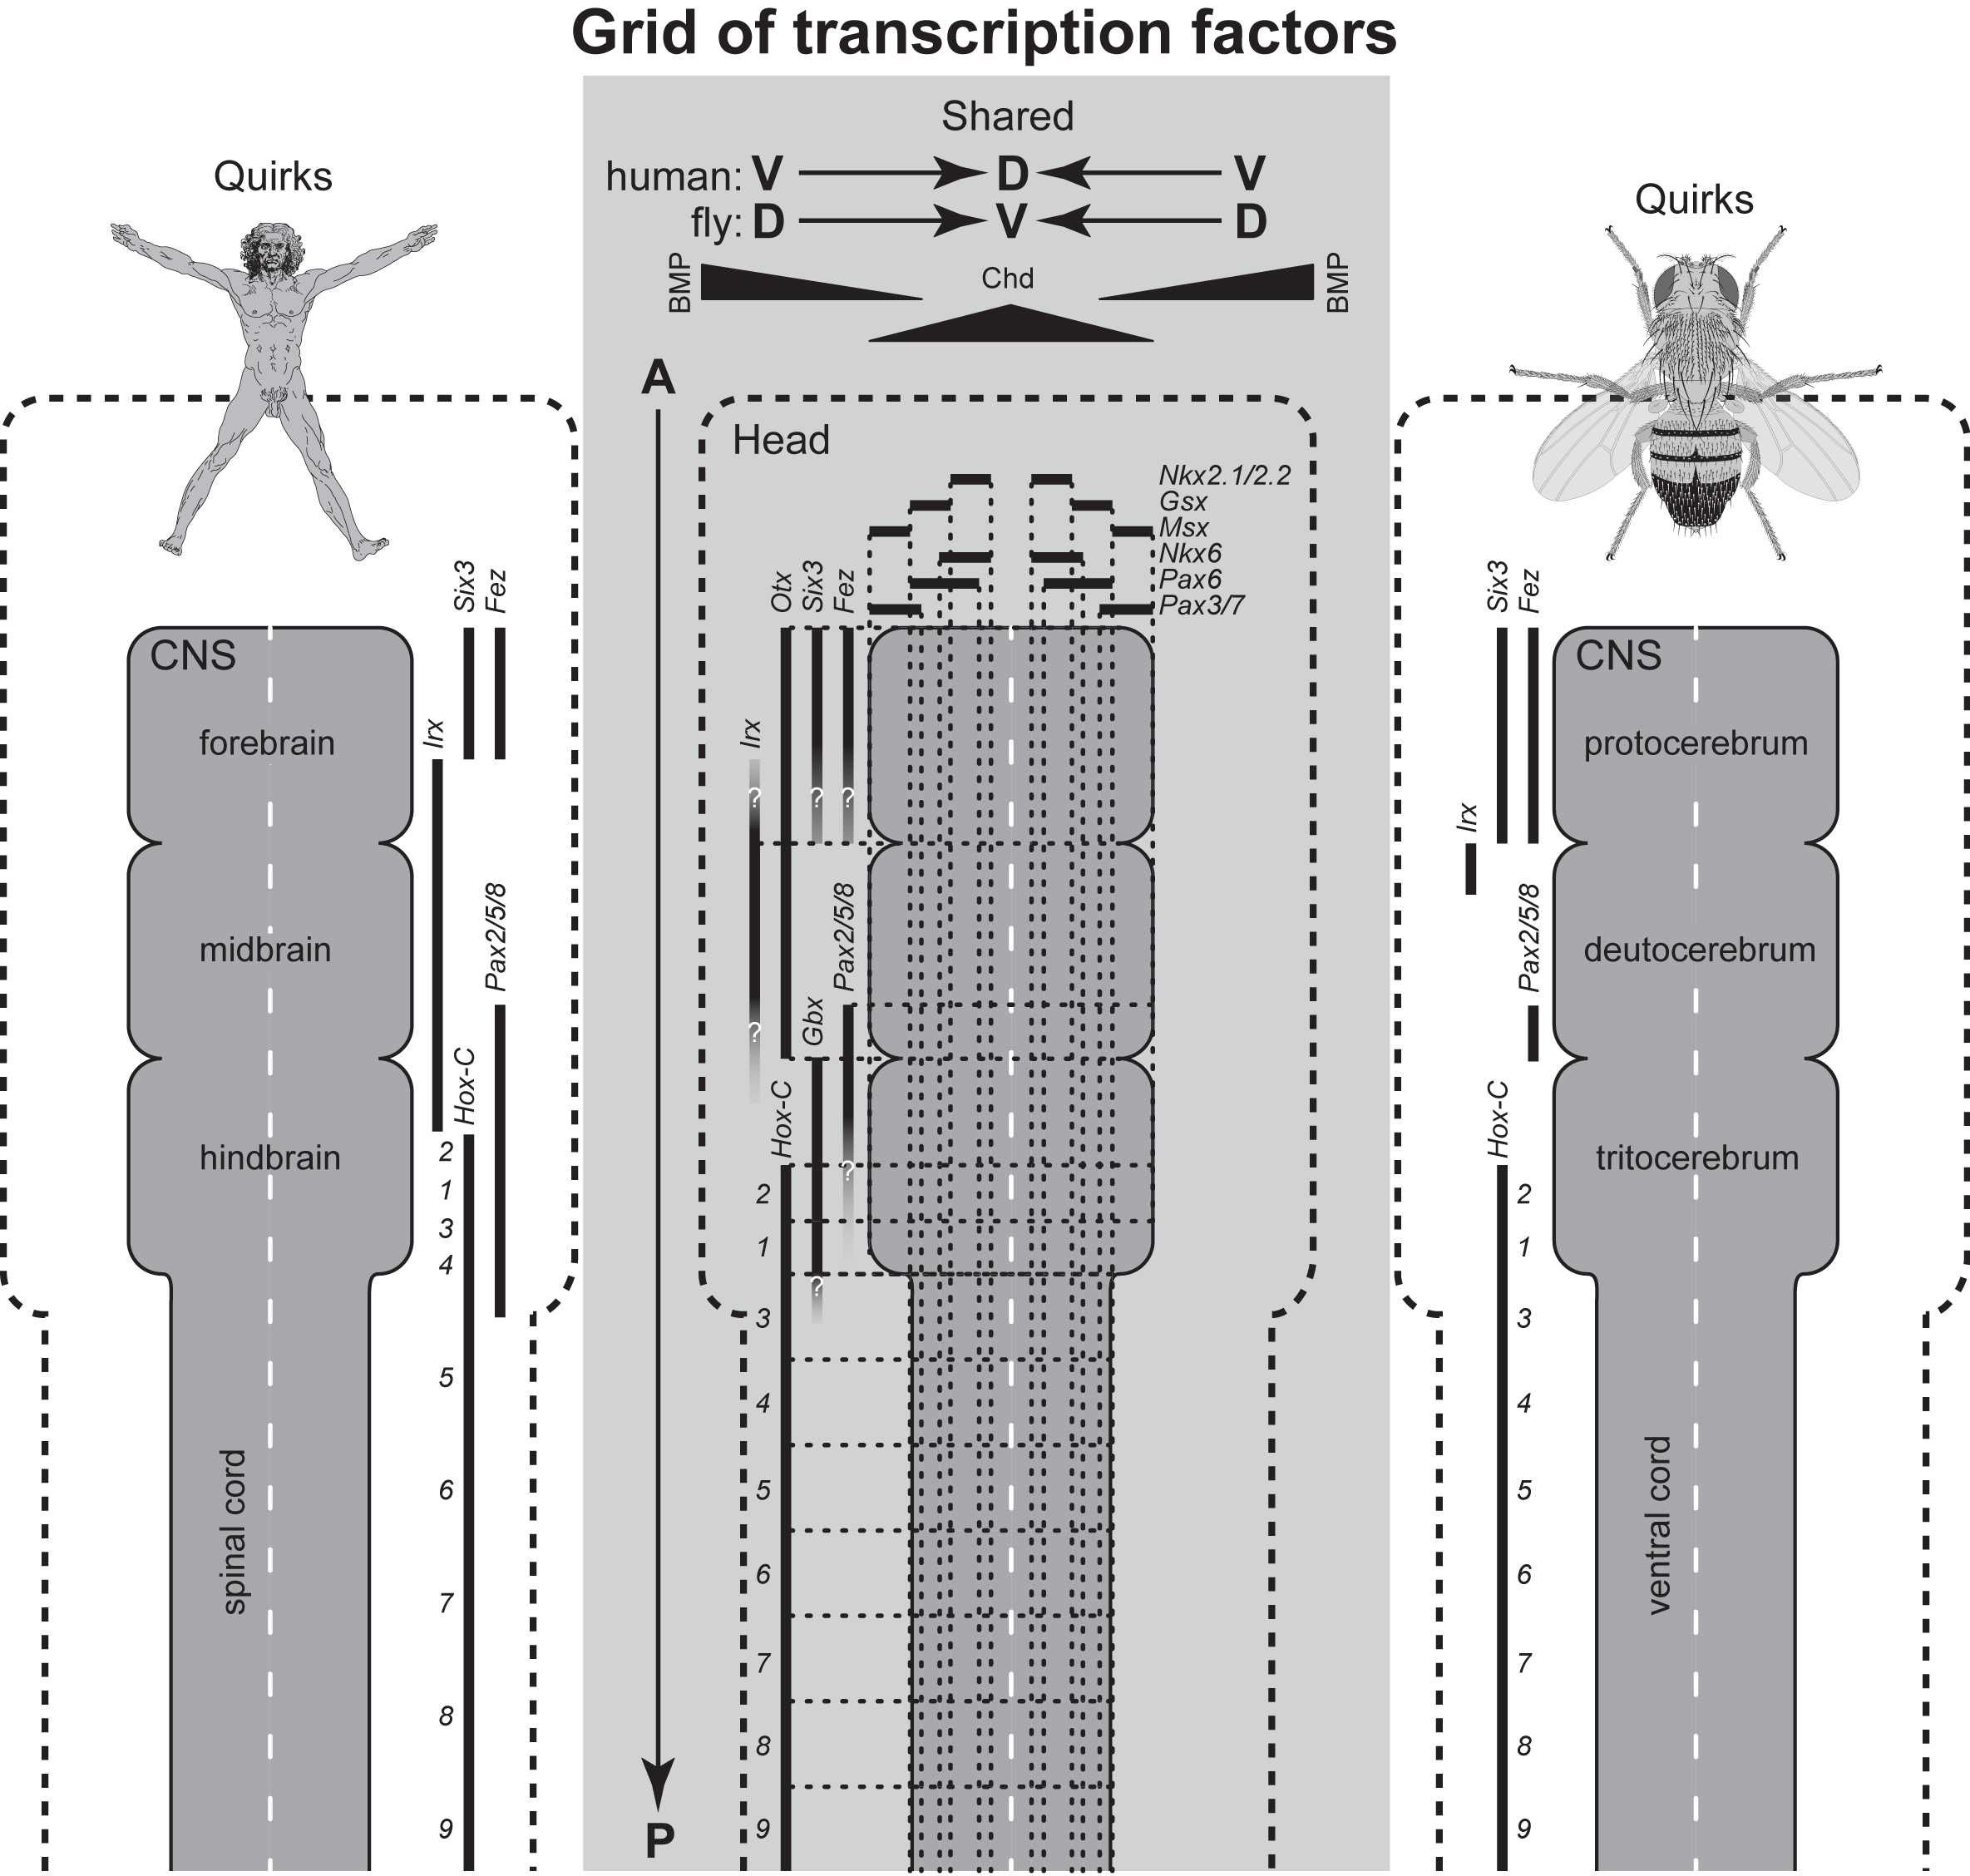 Gene expression in the central nervous system (CNS) of mammals and flies. The dark gray "totem pole" in the light gray rectangle is a consensus map of the urbilaterian CNS that is based on gene expression zones (bars) in mice, flies, and the annelid Platynereis, which represent all three main trunks of the bilaterian tree: Deuterostomia, Ecdysozoa, and Spiralia. The CNS is drawn as if the head (dashed outline) were fileted, flattened, and pinned to a dissecting tray. The ventral (V) midline of vertebrates corresponds to the dorsal (D) midline of flies due to the inversion of a basal chordate. However, brains are not perfect cylinders, so the (x, y) zones of the urbilaterian were surely not as rectilinear as drawn here, nor would all of the stripes have spanned the CNS. Moreover, the third ("z") axis of animal brains (not shown) emerges via time-dependent rules. Triangles denote gradients of the morphogens BMP (Bone Morphogenetic Protein) and Chordin (Chd) along the D-V axis. Gradients are not drawn for the A-P (anterior-posterior) axis because the original A-P morphogens are unknown. Flanking diagrams show differences ("Quirks") between mice (≈ humans) and flies that blur the termini of the corresponding bars (denoted by fading and a question mark) in the center (urbilaterian) map. The uncertainty in the Gbx bar is not due to a mouse-fly disparity, but rather to annelid data (not shown). Wherever names of homologs differ, the murine name is used. All of these genes encode transcription factors. Hox-C stands for the Hox Complex, with individual genes numbered (e.g., 1 = Hox1) to mark the anterior extent of their (overlapping) expression ranges. The rule of Hox colinearity, which is obeyed along the body's A-P axis, is disobeyed here insofar as Hox2 is expressed anterior to Hox1. |
|
Introduction: cover image Body axes: figure 2 | figure 3 | figure 4 | figure 5 | figure 6 Nervous system: figure 7 | figure 8 Vision: figure 9 | figure 10 | figure 11 | figure 12 | figure 13 Touch and hearing: figure 14 | figure 15 Smell and taste: figure 16 Limbs: figure 17 Epilogue: figure 18 The Interactive Fly resides on the web server of the Society for Developmental Biology. |